

Cutting-edge data visualisation tech gives people with vision impairments similar experience to sighted users
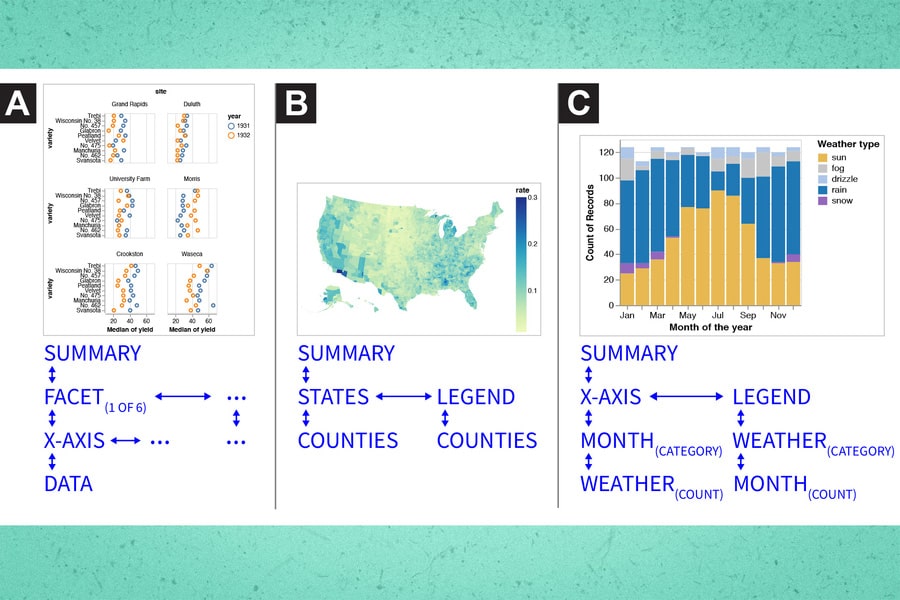
A graphic depicts three examples of structural and navigational schemes generated as part of the co-design process, and applied to diverse chart types, including the following: (a) a multi-view scatter plot faceting different Barley varieties by their geographic location; (b) a choropleth map of the United States; (c) and a stacked bar chart plotting the amount of a precipitation type by month of the year. The graphic includes decorative teal lines on the top and bottom of the image.
Innovative assistive technology prototypes, created by Massachusetts Institute of Technology (MIT) researchers, are making online information much more accessible to people who use screen readers by providing varying levels of detail in a few keystrokes.
It means people who are blind or have vision impairments can quickly and easily navigate through multiple levels of information in an online chart, for instance, offering a similarly rich experience to sighted users.
The concept was born out of the issue that screen readers – which read on-screen elements as text-to-speech – only describe the chart and a link to the underlying data table that is available, which is a “far cry” from the rich reading experience available to sighted users, according to MIT.
Thus, current inaccessible data visualisations exclude millions of visually impaired individuals from the opportunity to probe and interpret insights that are often presented through charts, such as health statistics.
MIT researchers wanted to change this with screen reader-friendly data visualisations that offer a similar experience for visually impaired users as sighted users.
They prototyped several visualisation structures that provide text descriptions at varying levels of detail, enabling a screen reader user to drill down from high-level data to more detailed information using just a few keystrokes.
The MIT team embarked on an iterative co-design process with collaborator Daniel Hajas, a researcher at University College London (UCL) who works with the Global Disability Innovation Hub (GDI Hub) and lost his sight at age 16. They collaborated to develop prototypes and ran a detailed user study with blind and low-vision individuals to gather feedback.
They created a framework to help designers think systematically about how to develop accessible visualisations. In the future, they plan to use their prototypes and design a framework to build a user-friendly tool that could convert visualisations into accessible formats.
The researchers defined three design dimensions as key to making accessible visualisations: structure, navigation, and description.
Structure involves arranging the information into a hierarchy. Navigation refers to how the user moves through different levels of detail. Description is how the information is spoken, including how much information is conveyed.
Using these design dimensions, the researchers developed several visualisation prototypes that emphasised ease of navigation for screen reader users.
One prototype, known as multiview, enabled individuals to use the up and down arrows to navigate between different levels of information (like the chart title as the top level, the legend as the second level, etc.), and the right and left arrow keys to cycle through information on the same level (such as adjacent scatterplots).
Another prototype, known as target, included the same arrow key navigation but also a drop-down menu of key chart locations, so the user could quickly jump to an area of interest.
The researchers tested these prototypes and an accessible data table, the existing best practice for accessible visualisations, with 13 blind and visually impaired screen reader users. They asked users to rate each tool on several criteria, including how easy it was to learn and how easy it was to locate data or answer questions.
Users said both prototypes enabled them to more rapidly identify patterns in the data. Scrolling from a high level to deeper levels of information helped them gain insights more easily than when browsing the data table, they said. They also enjoyed faster navigation using the menu in the target prototype.
The data table got top marks for ease of use.
Daniel commented: “I expected people to be disappointed with the everyday tools when compared to the new prototypes, but they still clung to the data table a bit, likely because of their familiarity with it.
“That shows that principles like familiarity, learnability, and usability still matter. No matter how ‘good’ our new invention is, if it is not easy enough to learn, people might stick with an older version.”
Drawing on these insights, the researchers are refining the prototypes and using them to build a software package that can be used with existing design tools to give visualisations an accessible, navigable structure.
They also want to explore multimodal solutions. Some study participants used different assistive devices together, like screen readers and braille displays, or data sonification tools that convey information using non-speech audio. MIT is exploring how these tools can complement one another when applied to a visualisation.
In the long-run, the researchers hope their work might lead to careful rethinking of web accessibility standards.