

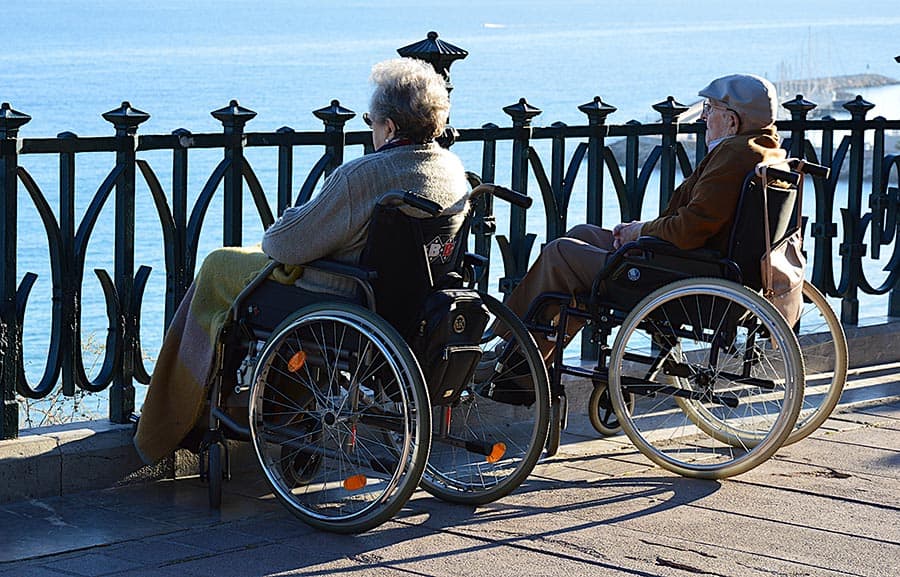
Children set to spend retirement in ill-health as study reveals ‘deep inequalities’ in life expectancy
The Centre for Ageing Better has revealed what the organisation calls ‘unacceptable’ inequalities in how long, and how healthily, babies born today in different parts of England can expect to live.
Ageing Better looked at three factors: life expectancy, healthy life expectancy (which estimates the number of years a person will spend in ‘very good’ or ’good’ general health), and disability-free life expectancy, which estimates the number of years spent without a long-lasting physical or mental condition that limits a person’s daily activities.
According to the organisation’s research, a boy born in Blackpool is set to live nine years less than a boy born in Westminster; a girl born in Camden can expect to live almost eight years longer than one born in Blackpool. Of the ten areas where life expectancy is highest, six are in London and three are in the South East.
For healthy life expectancy, a measure of how long people spend in ‘good’ or ‘very good’ health, the gaps are even wider, says Ageing Better, with boys born in Richmond-upon-Thames set to enjoy almost 20 more years of good health than those born in Blackpool. For girls, the biggest gap in healthy life expectancy is between Nottingham and Wokingham, with a difference of 18 years.
The gaps are almost as wide for disability-free life expectancy, which estimates the number of years spent without a long-lasting physical or mental condition that limits a person’s daily activities. Both boys and girls born in Blackpool can only expect to live to 53 before developing such a condition, compared to 69 for those born in Wandsworth.
The figures also show that the majority of babies born today could be on track for a retirement spent in ill-health and disability. In only two local areas across England can both boys and girls born today expect to reach 68 – the age at which they are currently set to draw their state pension – without a disability. In only six places can both boys and girls expect to reach that age in good health. If, as expected, the state pension age rises, the numbers could drop further.
Later this month, the government is set to publish its response to the consultation on its prevention green paper, setting out what action it intends to take. Ahead of its publication, the Centre for Ageing Better is calling for the government to recommit to make good on its promise to ‘level up’ and reduce the gap in disability-free life expectancy between the richest and poorest.
Anna Dixon, Chief Executive of Centre for Ageing Better, said: “Most of us are set to live many years longer than our parents or grandparents – and these extra years are a wonderful gift. But the opportunity of longer lives isn’t being shared equally, especially when it comes to how healthily we spend our later lives.
“These figures show that nowhere outside London and the South East can both boys and girls born today expect to reach their state pension age without a disability. We will be letting down today’s children if we fail to improve their prospects for a healthy later life.
“The deep inequalities this data reveals are unacceptable and cannot be tolerated. The government must recommit to the goal of closing the gap in disability-free life expectancy between the richest and poorest by 2035, and take the action needed to make good on that commitment.
“This doesn’t just require more funding for health services but investment in improved housing, better quality work and communities, as well as further regulation on tobacco, alcohol, and unhealthy foods.”
The Centre for Ageing Better examined ONS data on life expectancy, healthy life expectancy and disability-free life expectancy for more than 150 local areas in England. From its research, the results are as follows:
Life expectancy at birth (men)
Highest
- Westminster – 83.9
- Kensington and Chelsea – 83.3
- Harrow- 83.3
- Rutland – 82.8
- Camden – 82.7
Lowest
- Blackpool- 74.5
- Middlesbrough – 75.3
- Kingston upon Hull, City of – 76.0
- Manchester – 76.1
- Liverpool – 76.3
Life expectancy at birth (women)
Highest
- Camden – 87.0
- Kensington and Chelsea- 86.8
- Westminster – 86.5
- Richmond upon Thames – 86.4
- Harrow – 86.0
Lowest
- Blackpool- 79.5
- Manchester – 79.8
- Middlesbrough – 80.0
- Liverpool – 80.1
- Kingston upon Hull, City of – 80.2
Disability-free life expectancy at birth (men)
Highest
- Wandsworth – 69.4
- West Berkshire – 69.2
- Wokingham – 68.8
- Surrey – 68.2
- Bracknell Forest – 68.0
Lowest
- Blackpool – 52.8
- Sunderland – 55.9
- Manchester – 56.2
- South Tyneside – 56.4
- Middlesbrough – 56.5
Disability-free life expectancy at birth (women)
Highest
- Waltham Forest – 69.5
- Wandsworth – 69.1
- Surrey – 68.4
- Windsor and Maidenhead – 68.4
- Oxfordshire – 66.9
Lowest
- Blackpool – 53.0
- Stoke-on-Trent – 53.3
- Sunderland – 53.9
- Nottingham – 54.5
- Tameside – 55.3
Healthy life expectancy at birth (men)
Highest
- Richmond upon Thames – 71.9
- Wokingham – 70.2
- Windsor and Maidenhead – 70.0
- Rutland – 69.6
- Wandsworth – 68.9
Lowest
- Blackpool – 53.3
- Walsall – 56.4
- Sandwell – 57.1
- Kingston upon Hull, City of – 57.2
- Stoke-on-Trent – 57.4
Healthy life expectancy at birth (women)
Highest
- Wokingham – 72.2
- Oxfordshire – 71.7
- Surrey – 71.2
- Windsor and Maidenhead – 70.4
- Cheshire East – 69.8
Lowest
- Nottingham – 54.2
- Walsall – 55.7
- Stoke-on-Trent – 55.8
- Sunderland – 56.5
- Kingston upon Hull, City of – 56.6